
Data and Maps
HVRC GIS Resources
What is geospatial data and GIS?
Geospatial data describes how something occupies or is distributed across space. It typically combines location information (such as latitude and longitude) and attribute information (characteristics of the object, event, or phenomena of interest) with temporal information (time span or period at which the location and attributes exist). Geospatial technology refers to any technology that is used for gathering, manipulating, storing, and presenting geographical information. GIS, geographic information system, is one type of geospatial technology that creates, manages, analyzes, and maps out that data into a visual representation. It is an extremely useful tool that enables individuals and organizations to see, analyze, and understand patterns and relationships among different elements more easily.
On this page: HVRC GIS Resources | NYS Data Center | County Demographics | External Resources
Mapping HVRC’s Technical Assistance to Mid-Hudson Local Governments
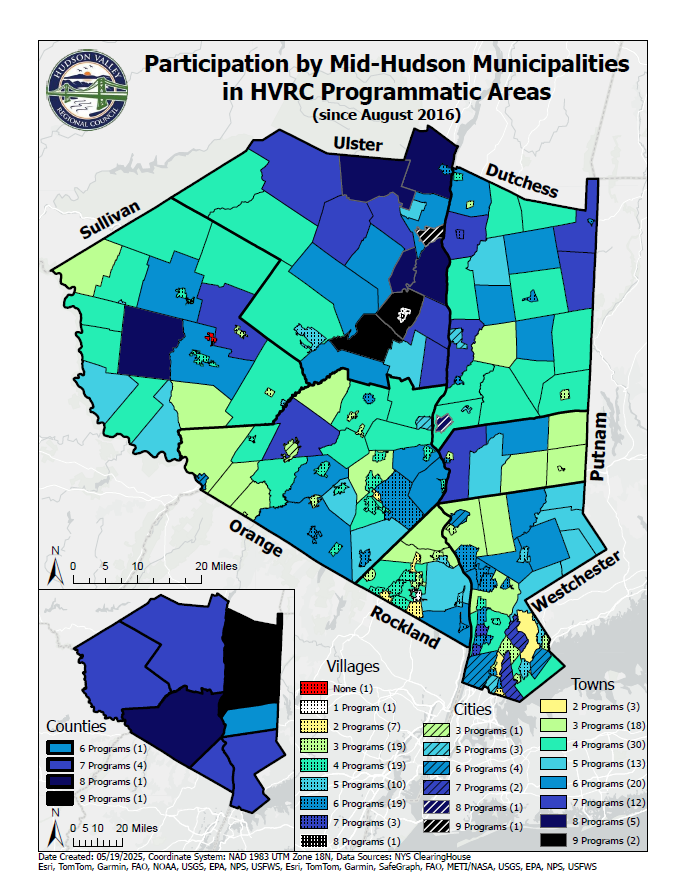
HVRC has developed maps using ArcGIS to visualize municipal engagement and identify areas where outreach efforts can be expanded. A map was created for each of HVRC’s eleven (11) programmatic areas. These areas are as follows:
- US DOC EDA Partnership Planning Program,
- NYS DEC 604(b) Water Quality Planning Program,
- US EPA Wastewater Technical Assistance,
- NYSERDA Clean Energy Communities Program,
- NYS Climate Smart Communities Program,
- Climate Action Planning Institute (CAPI),
- NYS DEC Climate Smart Communities Cohort Program,
- EPA CPRG Landfill Mitigation Program
- Ulster County Municipal Energy Technical Assistance
- Northern Border Regional Commission Grant Assistance, and
- Material Management Working Group
The first map summarizes all municipal participation in each of the nine (9) HVRC programmatic areas. Only county governments are participating in the material management working group at this time, so the maximum number of programs a city, town, or village can participate in is eight.
Current maps show municipal participation from August 2016 to April 2025. The maps will be updated annually in May. To view a PDF of the maps, click the thumbnail and scroll through the document to find the programmatic area of interest.
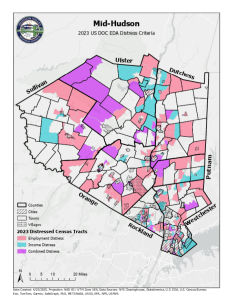
EDA Economic or Income Distress
The US Department of Commerce Economic Development Administration developed distress criteria to determine census tracts with an unemployment rate at least one percentage point greater than the national average unemployment rate and/or per capita income that is 80 percent or less than the national average per capita income. The EDA bases its determination for per capita requirements upon the most recent American Community Survey (ACS) published by the U.S. Census Bureau Projects and for unemployment rate upon the most recent data published by the Bureau of Labor Statistics (BLS) within the U.S. Department of Labor. Communities located in distress-identified census tracts that pursue EDA funding may have a higher likelihood of receiving an award.
Census Tract - Address Crosswalk
The Census Tract - Address Crosswalk, developed by HVRC using data from the U.S. Census Bureau and Stats America, is a tool that can be used to locate a project’s census tract and determine if that census tract has been designated as distressed under the mapped criteria. The Census Tract Crosswalk is directly related to the information provided on maps titled 2023 U.S. DOC EDA Distress Criteria.
NYS Data Center
The Hudson Valley Regional Council is a New York State Data Center.
The New York State Data Center (NYSDC) is located in the Division of Research and Statistics within the New York State Department of Labor. The State Data Center operates as part of a nationwide effort to improve public access to data provided by the U.S. Census Bureau.
The U.S. Census Bureau collects and tabulates data on a multitude of subjects such as population, social, economic and housing demographics, labor force data, health care, migration and transportation. These data play a critical role in understanding our local and larger surrounding communities. Census data also influence state and federal funding, aid decision making in the legislative process, and determine each state's number of congressional seats.
The State Data Center (SDC) Program is one of the Census Bureau's longest and most successful partnerships. The partnership between the 50 states, the District of Columbia, Puerto Rico, the island areas (American Samoa, Guam, The Commonwealth of the Northern Mariana Islands, and Virgin Islands) and the Census Bureau was created in 1978 to make data available locally to the public through a network of state agencies, universities, libraries, and regional and local governments.
Please contact us for assistance.
County Demographics
In 2017 a set of County Profiles were generated for each county in New York State. The County Profiles were developed and generated by the Cornell Program on Applied Demographics. The work was sponsored by the New York State Data Center in the New York State Department of Labor.
County Demographics: County Profiles